Logical Topology
LiveNX Logical Topology is a virtual interactive network diagram that provides enhanced situational awareness. It represents selected devices and sites of interest and their LAN and WAN networks connecting them. The topology projects Application traffic to visualize the path traffic traverses the network. Multiple tabs can be created and shard to build manageable, personalized use cases of interest.
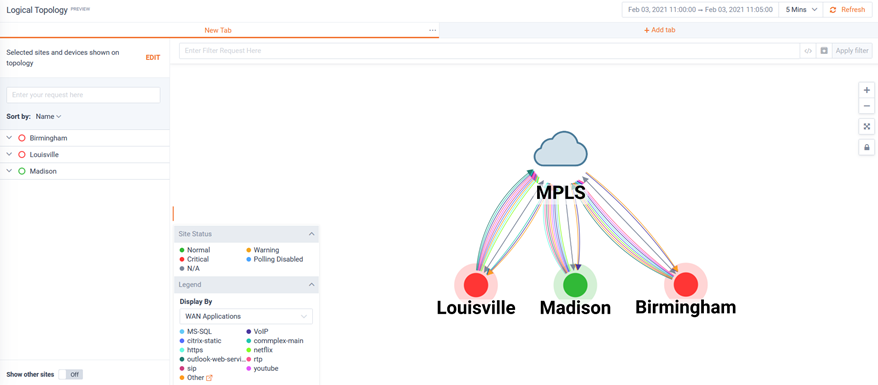
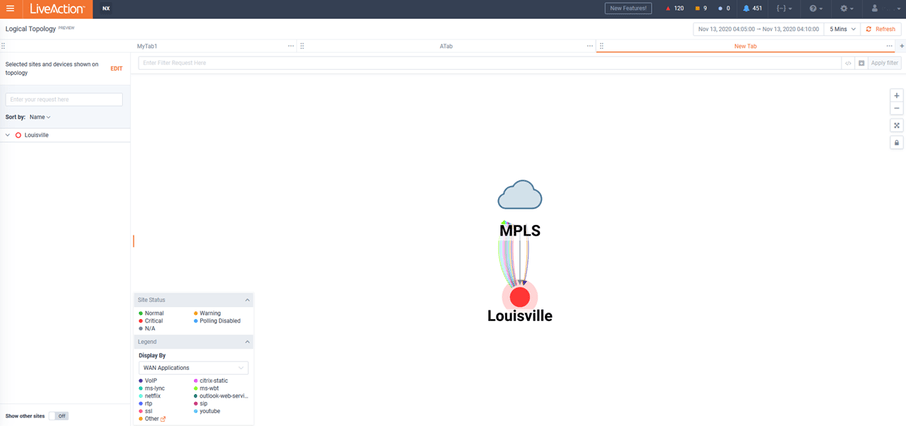
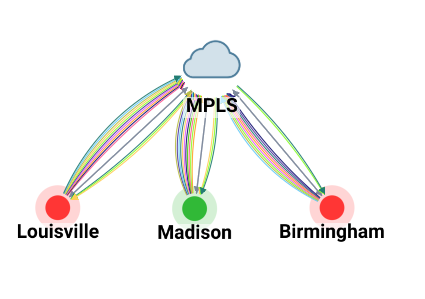
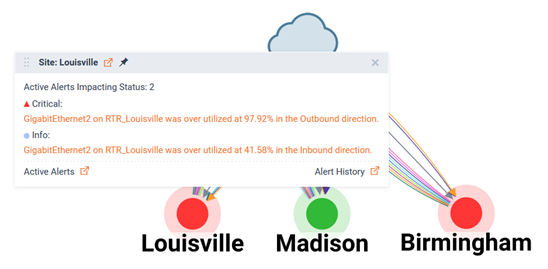
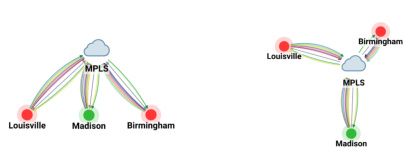
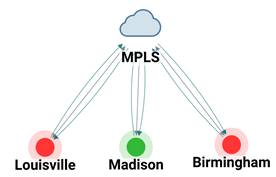
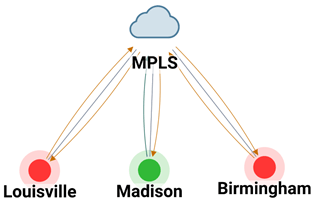
The example below shows three sites: Louisville, Madison, and Birmingham. They are interconnected via a WAN cloud called MPLS.
By single-clicking on the site Louisville, a pop-up will show the status of the object and provide links for more information.
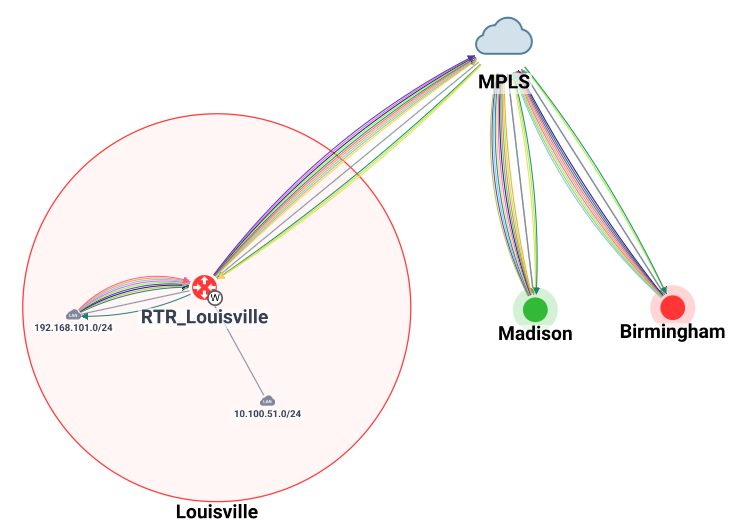
By double-clicking on the site icon of Louisville, the icon will expand to show the site’s selected devices. Application traffic will also be projected within the LAN.
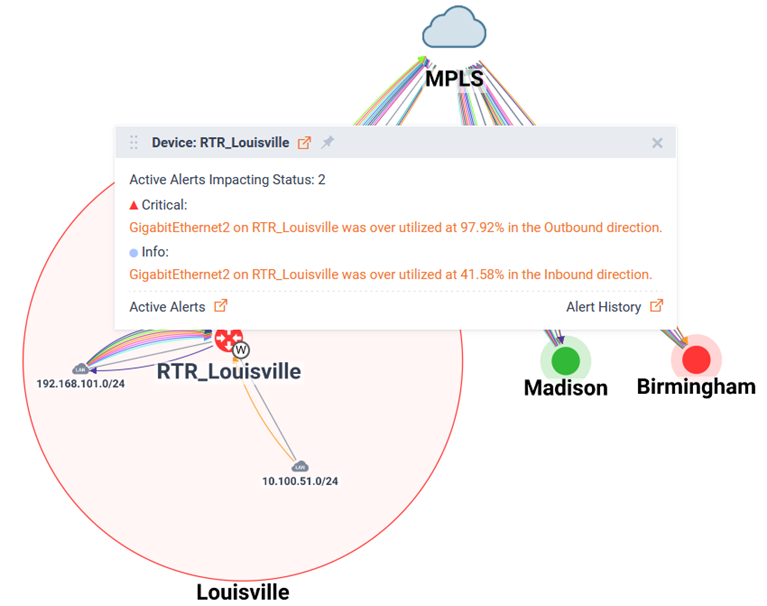
By single-clicking on the device RTR_Louisville, a pop-up will show the status of the object and provide links for more information.
Double-clicking on the Louisville site will return it back to a collapsed state.

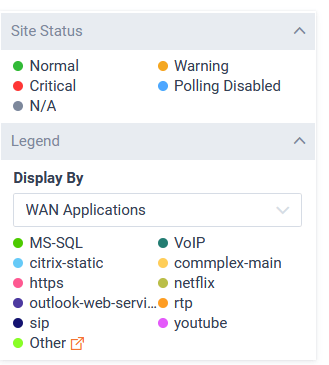
A legend is available at the bottom left of the Topology.
The Topology’s view can be re-organized by using the control icons to the upper right. These icons represent: Zoom In, Zoom Out, Zoom Fit, and Toggle Layout Lock.
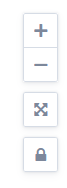
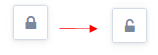
By clicking the Toggle Layout Lock, the icon will update to the unlocked position. In this state the diagram can be re-organized.
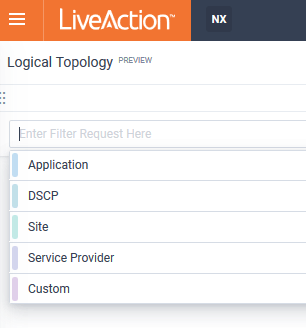
Filtering can be applied to find the specific Flows of interests.
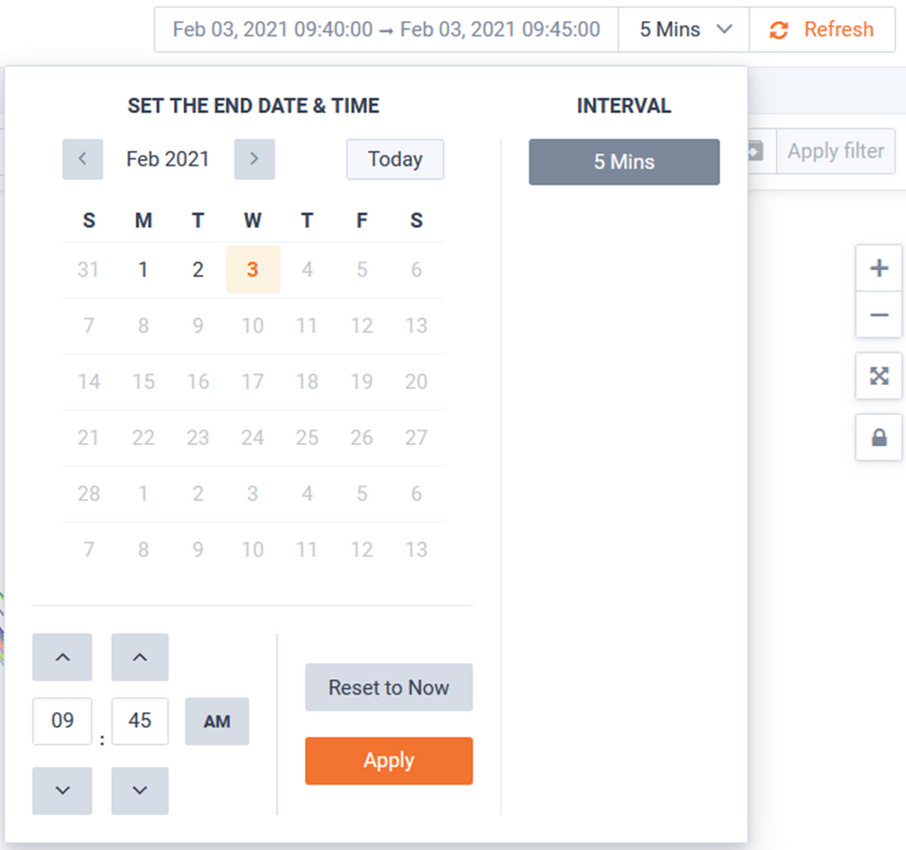
Historic time ranges can be selected for finding the Applications of interests.
The page can be refreshed by toggling the Refresh button in the top right of the page.
In the following example, note there is no Filter applied and the Legend’s set to Display By WAN Application.

The display’s legend will show the Top 10 Applications plus other.
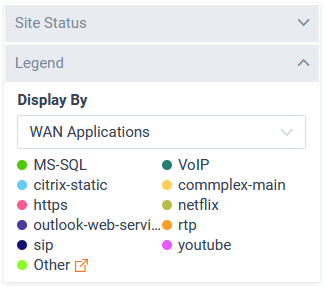
The Application traffic data projected on the Topology will represent these applications.

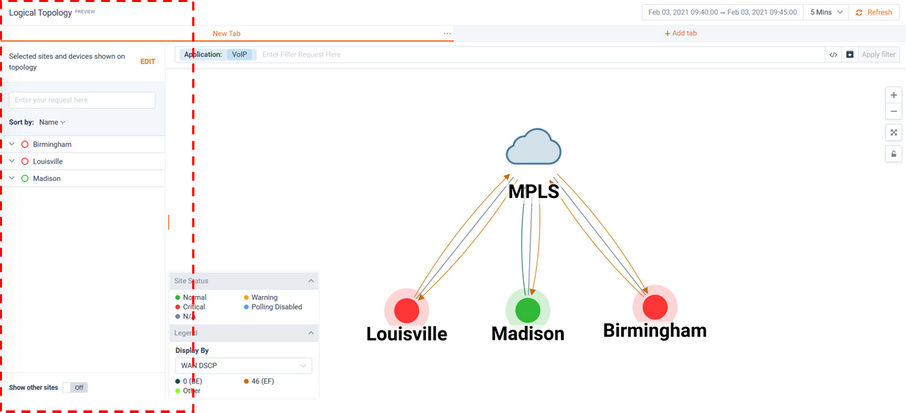
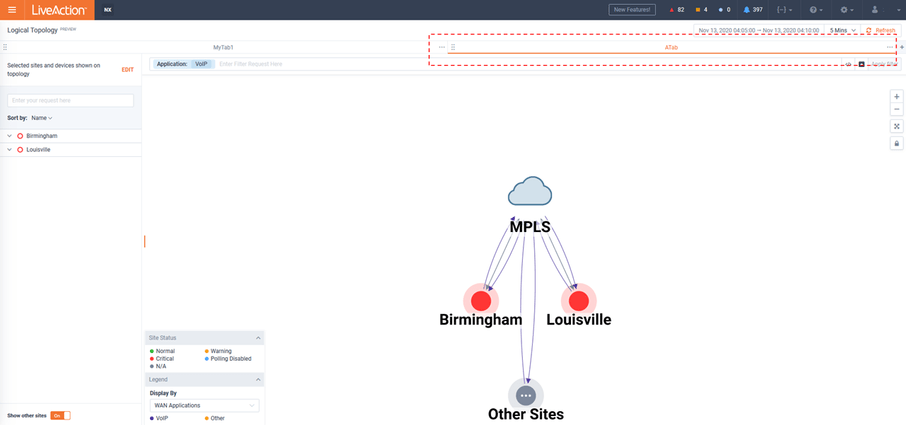
In the following example, a Filter of Application: VoIP has been applied and the Legend’s set to Display By WAN Application.

The display’s legend has updated to just so VoIP plus other.
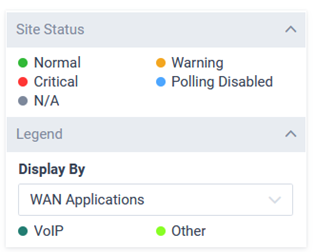
The Flow data projected on the Topology will represent just VoIP.
Clicking on the Flow arrows representing VoIP, will highlight them and cause a pop-up with more detail.
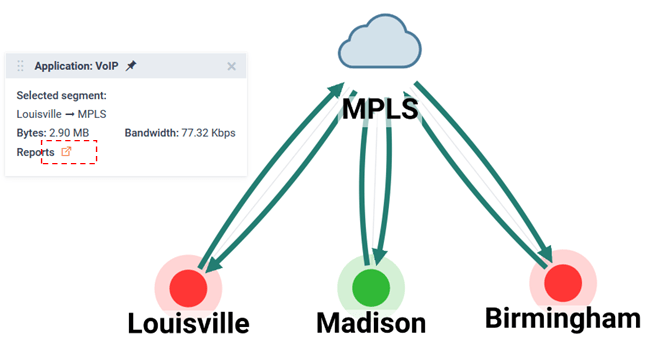
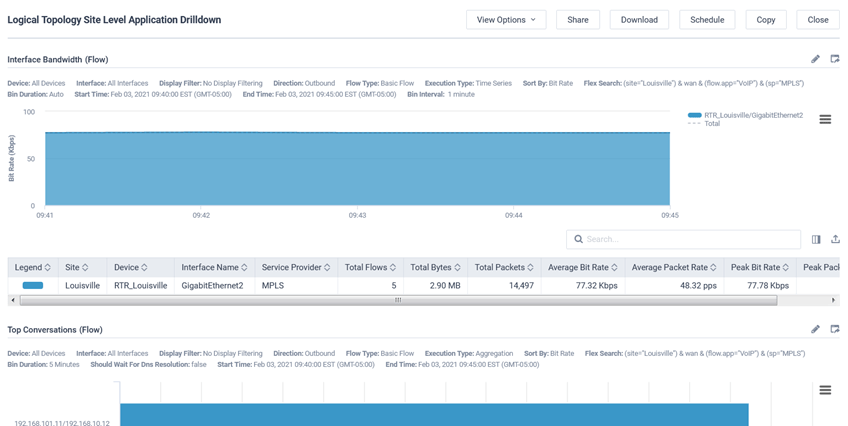
Clicking the Reports Icon will open a curated historic Report in a new tab.
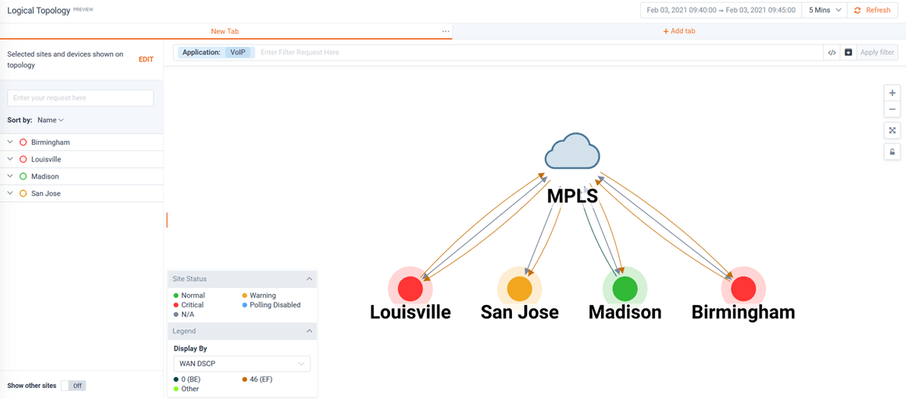
In the following example, a Filter of Application: VoIP has been applied but the Legend’s set to Display By WAN DSCP.

The display’s legend has updated to show the DSCP value of 0 (BE), 46(EF), and other.
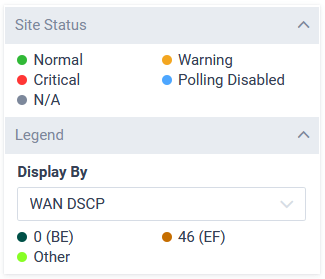
The Flow data projected on the Topology will represent these DSCP.
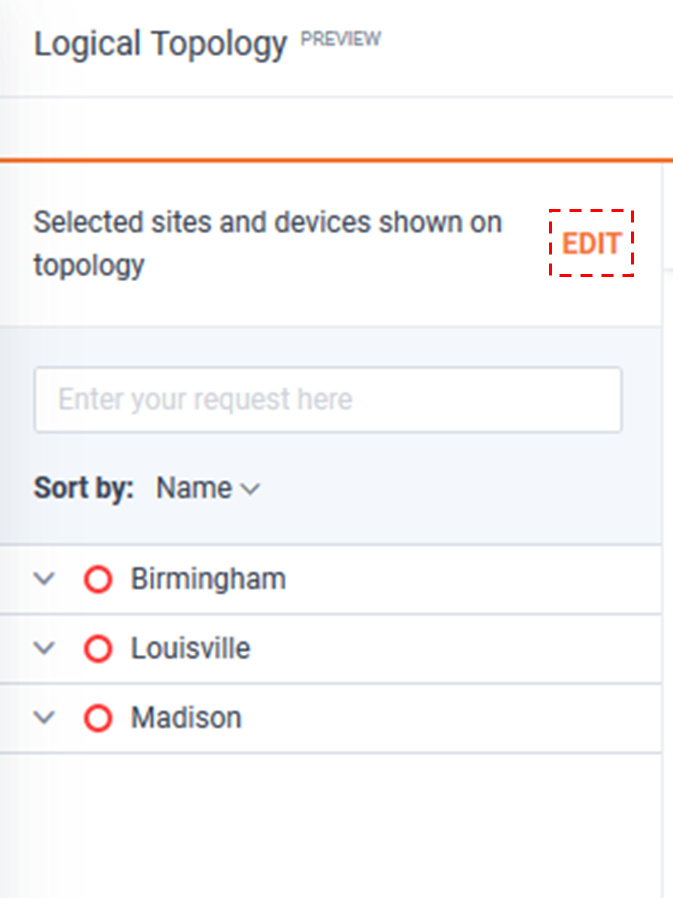
The Devices and Sites shown on the topology can be updated by using the control bar to the left.
Select the button.
Select the desired options and button.
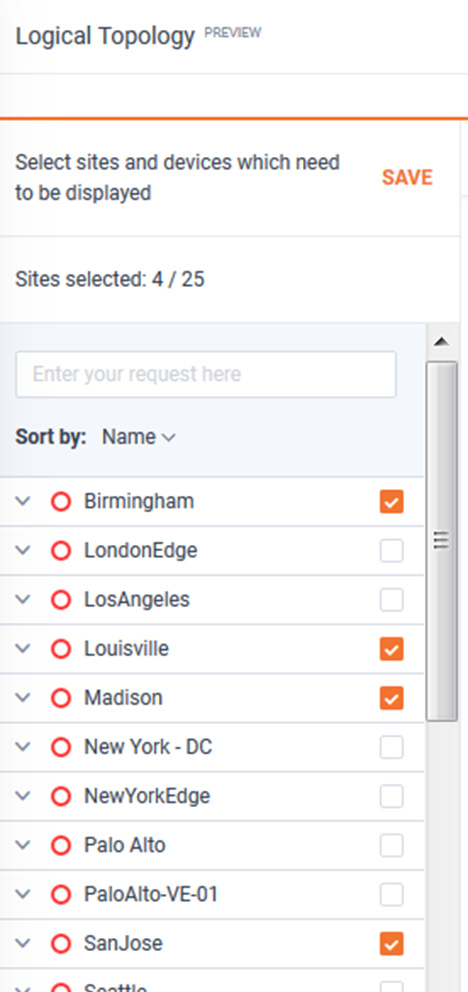
The Topology will be updated with the selected changes.
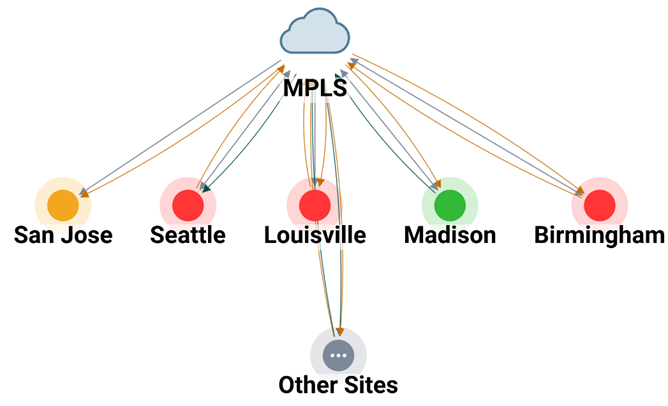
Note the Show Other Sites switch at the bottom of the site/device control bar.
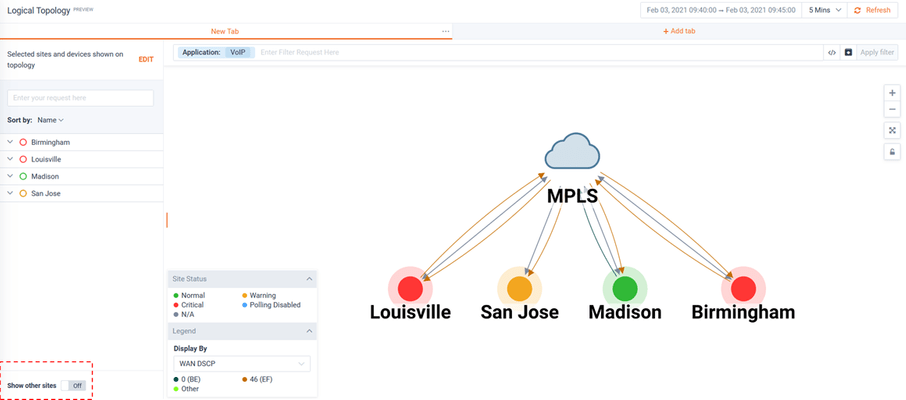
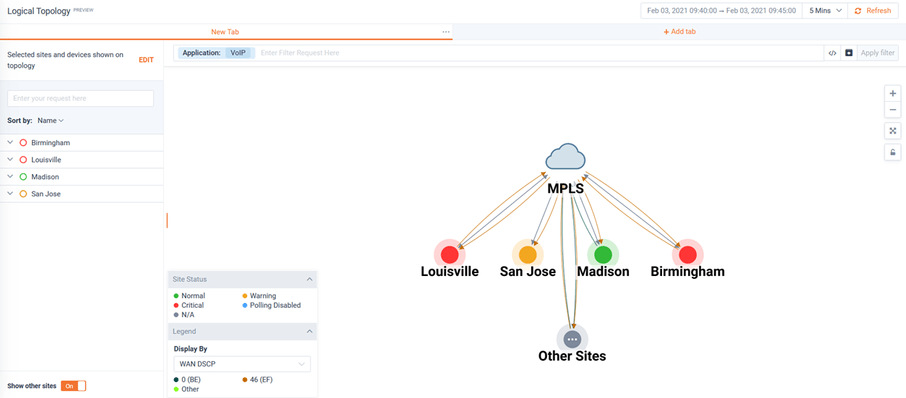
By enabling this switch, a new site named Other Sites appears. This will represent any Application traffic relevant to the applied Filter that is being sent/received both sites not added to the Topology.
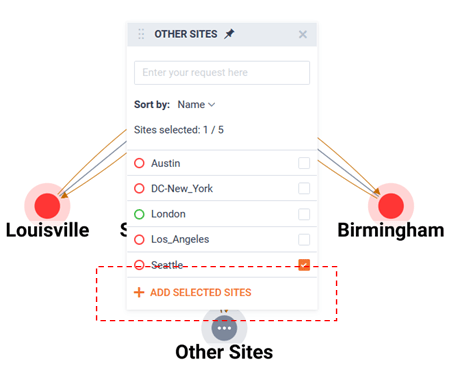
By clicking on the Other Sites icon, a list of the other sites sending/receiving the applicable Application will be listed.
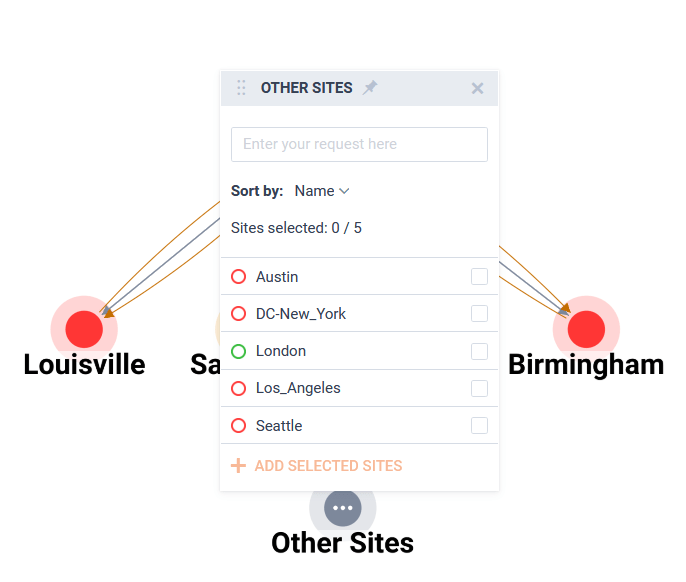
These sites can then be added to the Topology.
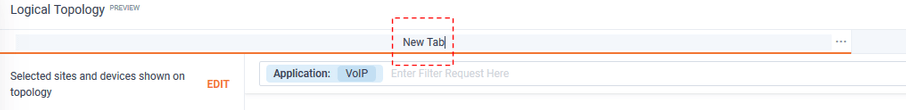
By clicking on a tab name at the top of the Topology, a tab can be renamed.
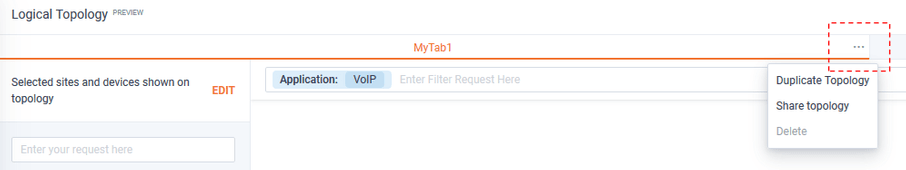
By clicking on a tab’s menu icon, a tab can be duplicated, shared, or deleted.
To create a new tab, select the + Add Tab icon.

To add a shared a tab, click on the desired icon in the shard tabs list.
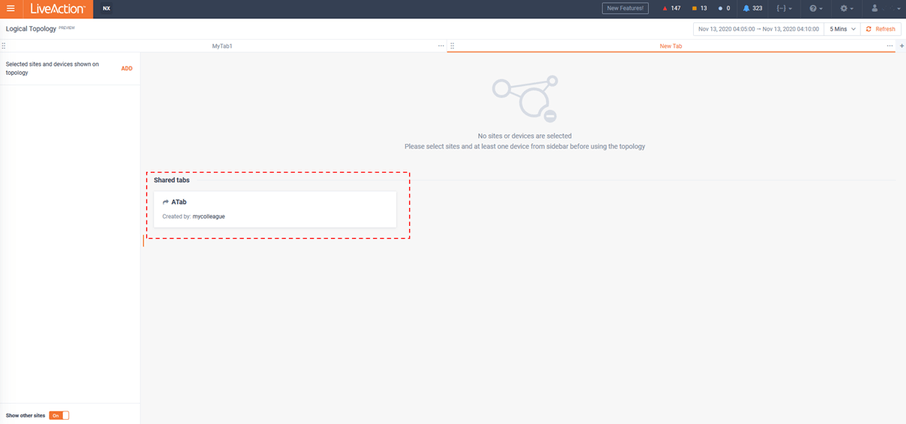
A new tab will be created with the topology of the shared tab.
To create a new tab from scratch, select the desired sites/devices from the control bar to the left of the window and select save.
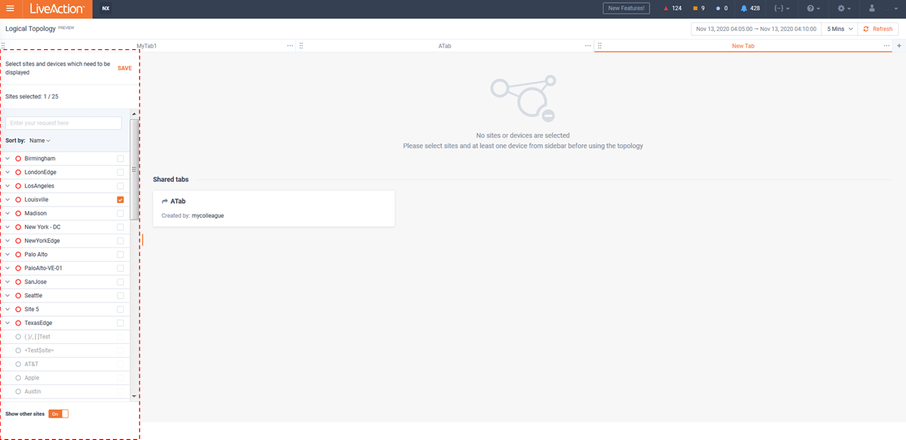
A new tab will appear with the select sites, devices and any relevant WAN clouds shown.